Visualizing Distributed Load Tests With JMeter, Elasticsearch, Fluentd, and Kibana
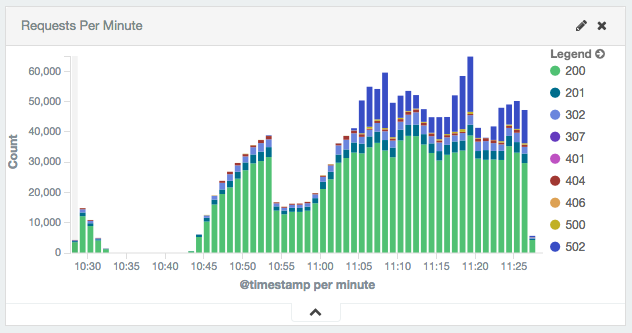
A web site’s requests-per-minute recorded by JMeter, stored in Elasticsearch, and visualized with Kibana.
Apache JMeter is a flexible tool for producing load against an application and measuring the results. We used it on a recent project to measure performance of a large and complex web site. The results of the performance tests required aggregation and visualization. The performance tests required a scale-out approach since the desired request rate exceeded the capabilities of a single JMeter node.
JMeter has its own built-in distributed performance testing capability. It also has the capability to visualize the test results. We found both lacking.
Visualizations
We needed the test result visualizations to be web-based for rapid dissemination to stakeholders.
It is possible to export JMeter’s visualizations as image files (.png or .jpg),
which can be hosted on a web server.
We wanted a more dynamic solution.
Distributed Testing
JMeter’s distributed performance tests require the slave nodes to send the test result data to the master node. This incurs a non-trivial amount of additional network I/O from the slaves to the master and will throttle the request rate on the slaves. Admittedly, there are means to tune the behavior.
We found JMeter’s distributed testing capability complex to set up and manage. It is not well suited to an elastic compute environment such as AWS. JMeter remote testing requires that all of the slave nodes use fixed IP addresses and TCP ports. We wanted something simpler for deployment orchestration and configuration which naturally supports the dynamic nature of AWS EC2 instances.
Ansible and Fluentd
We used Ansible for launching instances and orchestrating the execution of the performance tests on JMeter hosts. We used Fluentd on the JMeter hosts to parse the performance test result data and transmit to Elasticsearch.
Elasticsearch, Fluentd, and Kibana (EFK)
We love using Fluentd with Elasticsearch and Kibana (EFK instead of ELK).
(Side note: others love Fluentd too: it is one of Docker’s native logging drivers!)
Since JMeter can log its test results to a CSV file by adding arguments to the jmeter command (see below), it is a simple exercise to configure Fluentd’s tail input to watch for JMeter log files, parse the data, and transmit to Elasticsearch.
Implementation
The JMeter command and arguments we used on each node is long.
It has prerequisites for the log directory path and other things, too.
We created a Bash shell script wrapper that handles setup and configuration (i.e $LOG_DIR) before executing the JMeter command with CSV-logging arguments.
...

# Current date and time
DATETIME="$(date "+%Y%m%d%H%M%S")"

# JMeter log location
LOG_DIR="${HOME}/jmeter-log/${VERSION}/${ENV}/${DATETIME}"

mkdir -p "${LOG_DIR}"

${JMETER_BIN}/jmeter -n -t "${DIR}/perf-test.jmx" -l "${LOG_DIR}/perf-test-${DATETIME}.jtl" \
-Jjmeter.save.saveservice.print_field_names=false \
-Jjmeter.save.saveservice.output_format=csv \
-Jjmeter.save.saveservice.timestamp_format="yyyy-MM-dd HH:mm:ss" \
-Jjmeter.save.saveservice.default_delimiter=, \
-Jjmeter.save.saveservice.data_type=true \
-Jjmeter.save.saveservice.label=true  \
-Jjmeter.save.saveservice.response_code=true \
-Jjmeter.save.saveservice.response_data=true \
-Jjmeter.save.saveservice.response_message=true \
-Jjmeter.save.saveservice.successful=true \
-Jjmeter.save.saveservice.thread_name=true \
-Jjmeter.save.saveservice.time=true \
-Dnetworkaddress.cache.ttl=0 \
-Dsun.net.inetaddr.ttl=0 ${@}

...
Ansible executes the shell script perf-test.sh as a command task in parallel on JMeter hosts.
- name: Fire in the hole
  command: "./perf-test.sh"
  args:
    chdir: "{{ ansible_user_dir }}/infrastructure/load-testing"
  environment:
    RATE_HOLD_TIME: "{{ hold_time }}"
  register: perftest_result
  async: "{{ ( ( hold_time | int() * 60 ) + 300 ) | int()}}"
  poll: 60
Fluentd uses a tail input to watch for JMeter log files, transforms each record by adding some important reporting meta-data (app_version, loadtest_env, loadtest_start), and then transmits to an Amazon Web Services Elasticsearch Service Domain:
<source>
  @type tail
  path /home/ubuntu/jmeter-log/*/*/*/*.jtl
  pos_file /var/log/td-agent/jmeter.jtl.pos
  read_from_head true
  tag jmeter.*
  format csv
  keys timeStamp,elapsed,label,responseCode,responseMessage,threadName,dataType,success,failureMessage,bytes,grpThreads,allThreads,Latency,IdleTime
  types timeStamp:time,elapsed:integer,label:string,reponseCode:integer,responseMessage:string,threadName:string,dataType:string,success:bool,failureMessage:string,bytes:integer,gr
pThreads:integer,allThreads:integer,Latency:integer,IdleTime:integer
  time_key timeStamp
  # -Jjmeter.save.saveservice.timestamp_format="yyyy-MM-dd HH:mm:ss"
  time_format "%F %T"
  read_lines_limit 100
</source>

<filter jmeter.**>
  @type record_transformer
  enable_ruby true
  <record>
    hostname "#{Socket.gethostname}"
    app_version ${tag_parts[4]}
    loadtest_env ${tag_parts[5]}
    loadtest_start ${tag_parts[6]}
  </record>
</filter>

# Send JMeter data to AWS Elasticsearch Service Domain
# https://github.com/atomita/fluent-plugin-aws-elasticsearch-service
# Kibana index pattern: jmeter-[YYYY.mm.dd]
<match jmeter.**>
  type "aws-elasticsearch-service"
  logstash_format true
  logstash_prefix jmeter
  type_name jmeter
  include_tag_key true
  tag_key "@log_name"
  flush_interval 1s

  <endpoint>
    url https://search-loadtest-reports-as03adfa042kjaslkn42lll234.us-west-2.es.amazonaws.com
    region us-west-2
  </endpoint>
</match>
Kibana for visualization
Once the JMeter data is present in Elasticsearch, Kibana visualized the aggregations of the performance test data over time.
Fluentd’s CloudWatch module was also used to retrieve metric data for the AWS components involved in the test and visualized in Kibana: Elastic Load Balancer, EC2 Autoscaling Groups, RDS, and Elasticache.
Kibana Dashboards for JMeter and Cloudwatch metrics allowed us
to display a nice inline visualized summary of the results of the performance test
using HTML iframes in a report web-page.
Performance test reports were accessible by persistent URLs
and distributed to stakeholders (engineering teams, product teams, etc.):

Closing thoughts
We tried, initially, to use the native orchestration and visualization capabilities of JMeter. The effort required and results were unsatisfying. We were pleased with results of using Ansible, Elasticsearch, Fluentd, and Kibana along with JMeter. This is a great case of using software, leveraging the strengths of each, in a composable manner to achieve a goal.